In traditional undergraduate statistics courses we are generally taught that outliers are bad news. Outliers are pesky peeps who don’t conform. They stand out from the pack. We should banish them from our data set and be done with them. However there are a number of points to consider about our outlying data points that we should pause to reflect on before being too rash.
There are two dimensions to any given data point’s position that need to be examined:
- Discrepancy is basically a distance measure. How far away from the main body of the data does this data point sit.
- Leverage is the degree to which a particular data point impacts a model.
These two position dimensions combine to create the notion of influence. An influential data point is one which is both discrepant and high in leverage. In other words it is a data point that sits in a position inconsistent with not only the body of data but its trajectory were you to attempt to predict scores beyond the range your data set contains. It is a data point that changes your model and hence your interpretation of your results.
When deciding if you have outliers within your data set you generally are interested in identifying if you have any data points high on discrepancy at univariate, bivariate and multivariate levels, and then deciding if they are unduly influential to your results.
It seems that many of us have become quite trigger happy in removing outliers. Either as a result of what we were taught in our undergraduate years, or by following conservative texts which send you on a murderous rampage. However, there are many reasons to be much more circumspect in the removal of outliers.
Commonly, outliers are removed based purely on discrepancy measures rather than influence measures. However it is entirely possible for an outlier to be high on discrepancy and hence quite distant from the main body of data, while being low on influence, i.e, still consistent with model parameters. I have regularly consulted with students and researchers who have decided to exclude participants from their data set in this way. Whether they were found to have standardised scores on individual variables in excess of +/- 3.29 (a univariate discrepancy measure), or perhaps with high standardised residuals or Mahalanobis scores (multivariate discrepancy measures). When sample sizes are low the resultant lack of power from such ruthless participant culling seems a high price to pay.
There are numerous measures of influence that can be consulted to aid decision making in outlier removal. These vary from broad brush overall model influence measures such as Cook’s distance, to the more specific standardised DfBetas which give an indication of how the intercept and each individual predictor’s regression coefficient is impacted by a participant’s scores. Often, while discrepancy measures suggest the presence of outliers, influence measures such as these suggest that most if not all of these outliers are not unduly influential to statistical results. In these instances there is no justification to remove the outliers at all and in fact there is a stronger argument to retain them to maximise power.
Quite apart from whether or not the appropriate statistical tools are used to determine whether an outlier should be removed is a more philosophical question. The underlying philosophy of the hunt for outliers in a data set is that anyone that does not conform to the body of data is a bad thing. That we should want to assess a data set that neatly conforms to some beautiful mythical bell curve and any one who strays from that divine distribution is an abomination. When a researcher obtains a sample of data they are generally arguing that it is representative of some population. They argue if they have been lucky enough to have the time and resources to obtain a truly random sample of that population (as opposed to the convenience sample that the vast majority of research is conducted on) then its sample statistics should be an unbiased estimates of the population parameters. Hence any outlier is seen as a fly in the ointment. But I ask you to consider the following clumsily drawn figures in my own fair hand. What if our outliers actually reveal results closer to the truth via their presence than their absence? Perhaps our distribution of scores does not cover the full gamut of possible scores and our outlier helps us to join the dots of how that relationship would continue with scores in a higher or lower bracket?
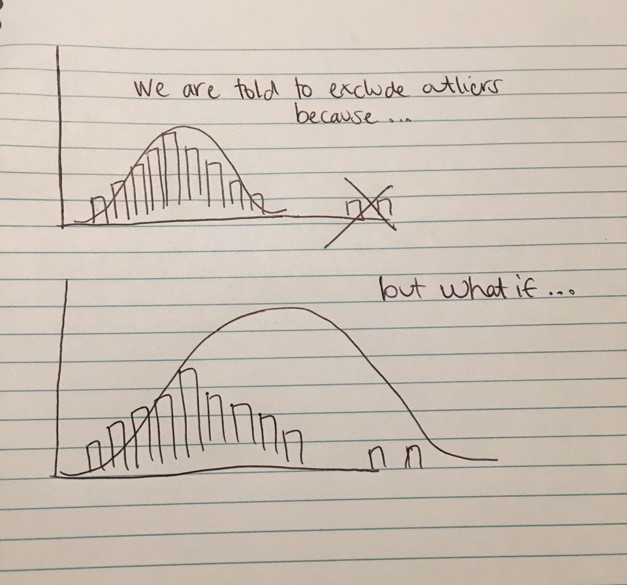
Suddenly militantly deleting outliers willy nilly doesn’t seem quite so smart does it!
And who are we to determine that someone’s data is inconsistent and that we should discard it. Sure sometimes outliers occur because the data provided by someone is not a genuine reflection of their thoughts and feelings on the issues under study but perhaps their penchant for creating pretty undulating patterns as they circle likert responses down a survey page. Sometimes it is clearly not ”genuine” data. But sometimes it actually IS genuine data. And by deleting it we do that person and our research an injustice.
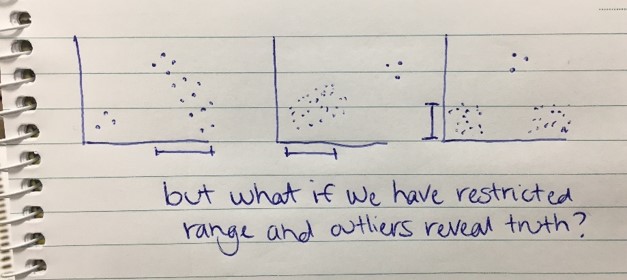
I think at the very least we should explore the possibility that our results WITH our outlier included are more valid than with them removed. And that readers of our research deserve the opportunity to consider what our results look like with and without the presence of that supposed outlier so they can make up their own minds. Even if the alternative results are presented in an appendix rather than given equal time on centre stage in our results sections. And the nature of those outlying cases needs to be explored not just as mathematical nuisances but conceptually in terms of what their profile of scores means for the theory and hypotheses being tested. In particular if we have a restriction of range issue with any of our variables which could lead to us not fully appreciating the true strength of relationships between variables or group differences.
So the next time you are examining outliers in your shiny new data set, stop, pause and reflect. Because outliers are people too you know.

